
The housing market is no longer moving as one national story. New York is trapped by high rents andlow mobility. Miami is desirable but squeezed by insurance, taxes, and total monthly cost. Texas is normalizing as inventory rises and sellers cut prices. Los Angeles is softening but still brutally expensive. San Francisco is tight again because supply is scarce and tech wealth is back in the game.
The real estate market today is not crashing, but it is not healthy in the way most people want it to be.It is a divided market where some cities are softening, some are still brutally competitive, and almost every where the real problem is not just the price of the house. The real problem is the full monthly cost of living: mortgage rates, insurance, property taxes, rent, utilities, food, gasoline, repairs, HOA fees, and the cost of oil moving through the economy.
That is why so many people feel confused. On paper, the market has improved in a few ways. Mortgage rates are lower than they were a year ago, inventory has improved in many areas, and some sellers are finally pricing more realistically. But for the average household, the numbers still feel heavy. A home that looks cheaper than last year can still be unaffordable once the monthly payment, insurance, taxes, energy costs, and day-to-day living expenses are added together.
The national median existing-home price reached $417,700 in April 2026, up only 0.9% from a year earlier, while existing-home sales were running at a 4.02 million seasonally adjusted annual rate, essentially flat from a year ago (National Association of Realtors). National active listings rose to just over 1 million in April, up 4.6% year over year, but inventory was still 11.8% below April 2019 levels, which means supply has improved without fully normalizing (Realtor.com April 2026 Housing Report). The result is a market that is no longer as frantic as 2021, but still not affordable enough for millions of buyers.
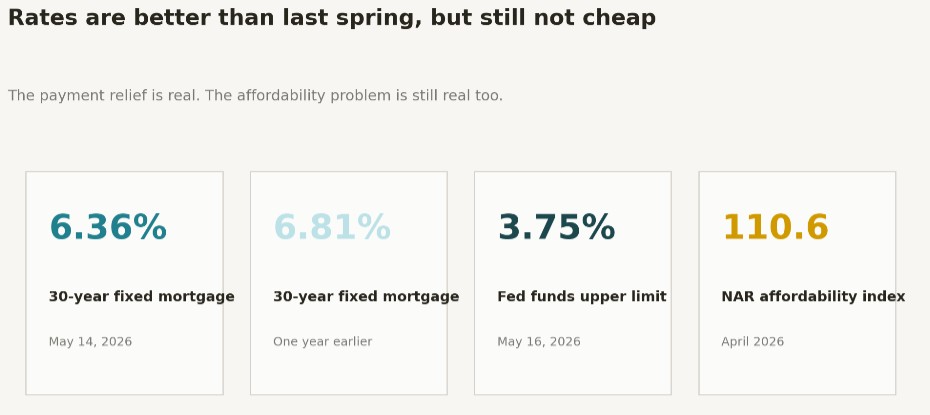
Chart note: The rate picture is better than it was last spring, but the payment environment is still difficult. The 30-year fixed mortgage averaged 6.36% as of May 14, 2026, while the NAR affordability index stood at 110.6 in April 2026 (Freddie Mac, National Association of Realtors). ** The Big Picture: The Market Is Moving Sideways, Not Falling Apart**
The current real estate market is best described as a sideways market. Sales are low, prices are mostly holding, inventory is improving, and buyers are more cautious. This is not the same as a crash. A crash usually requires forced selling, widespread distress, or a sudden collapse in demand. Today’s market has weakness, but it also has several forces holding prices up.
The first force is limited supply. Total existing-home inventory reached 1.47 million units in April 2026, equal to 4.4 months of supply, up from 4.2 months in March and 4.3 months one year earlier (National Association of Realtors). A balanced market is often described as roughly four to six months of supply, so the national market is closer to balance than it was during the pandemic boom, but it is not flooded with inventory. Realtor.com reported that active inventory was still 12.5% below typical 2017-2019 levels, even after a year-over-year increase in listings (Realtor.com April 2026 Housing Report).
The second force is the mortgage “lock-in” effect. Many existing owners still have mortgage rates farbelow today’s rates, so they are reluctant to sell and buy again at a higher payment. In California, for example, 77% of homeowners had mortgage rates under 5% as of September 2025, compared with current rates around the low-to-mid 6% range, making moving financially painful for many households (California Legislative Analyst’s Office). This same logic applies nationally: even when people want a different home, they may stay put because replacing a 3% or 4% mortgage with a 6% mortgage changes the entire monthly budget.
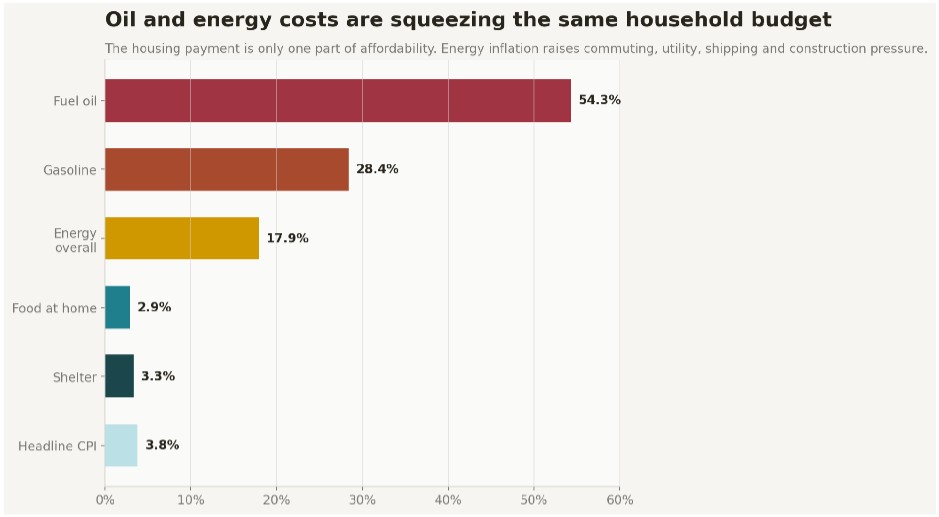
Chart note: Energy inflation is the hidden affordability pressure running through the market. Gasoline, diesel, fuel oil, utilities, construction inputs, and shipping costs all affect the householdbudget or the cost to build, repair, insure, and maintain housing (U.S. Bureau of Labor Statistics).
The third force is that many sellers are not desperate. Distressed sales represented only 2% of April 2026 existing-home transactions, unchanged from March and April 2025 (National Association of Realtors). That matters because a market can slow down without collapsing if most owners have equity, fixed-rate mortgages, and no urgent reason to sell at a steep discount. ** Interest Rates: Better Than Last Year, Still Too High for Affordability**
Mortgage rates have improved compared with last year, but not enough to solve affordability. Freddie Mac reported that the average 30-year fixed-rate mortgage was 6.36% as of May 14, 2026, down from 6.81% one year earlier, while the 15-year fixed-rate mortgage averaged 5.71%, down from 5.92% a year earlier (Freddie Mac Primary Mortgage Market Survey). That is meaningful relief, but it is not the same as returning to the ultra-low-rate environment that shaped buyer expectations during the pandemic years.
The Federal Reserve’s policy rate is also still restrictive by pre-pandemic standards. The upper limit of the federal funds target range was 3.75% on May 16, 2026, according to FRED data from the Federal Reserve Bank of St. Louis (FRED Federal Funds Target Range). Mortgage rates do not move one-for-one with the Fed funds rate, but they are heavily influenced by inflation expectations, Treasury yields, credit conditions, and investor demand for mortgage-backed securities.
This is why buyers feel stuck. A move from 7% to the mid-6% range helps, but a 6.36% mortgage on a high-priced home still produces a large monthly payment. In April 2026, the median existing-home price was $417,700, and the average 30-year mortgage rate for the month was 6.33% (National Association of Realtors). Lower rates have helped bring some buyers back, but they have not restored broad affordability. * The housing market has not become easy. It has become slightly less impossible for some buyers, while remaining completely out of reach for many others.*
Oil, Energy, and Inflation: Why Housing Feels More Expensive Than the Listing Price
The cost of oil matters to real estate because energy prices touch almost everything. Higher oil prices can raise gasoline costs, diesel costs, shipping costs, construction input costs, airline fares, and household utility pressure. Even when the price of a home is flat, the cost of living around that home can still rise.
The April 2026 Consumer Price Index showed headline inflation up 3.8% over the prior 12 months, while energy prices were up 17.9%, gasoline was up 28.4%, and fuel oil was up 54.3% (U.S. Bureau of Labor Statistics). BLS also reported that energy accounted for over 40% of the monthly increase in the overall CPI in April 2026, which shows how strongly energy prices were pushing the inflation conversation at that moment (U.S. Bureau of Labor Statistics).
The Energy Information Administration’s 2026 outlook projected Brent crude averaging $96 per barrel, with a peak around $115 per barrel in the second quarter of 2026, while retail gasoline was forecast to average $3.70 per gallon and diesel $4.80 per gallon for the year (U.S. Energy Information Administration). The EIA tied the price shock to geopolitical conflict affecting oil flows through the Strait of Hormuz, production shut-ins, supply-chain constraints, and low diesel inventories (U.S.Energy Information Administration).
For housing, this matters in three practical ways. First, higher gas prices reduce disposable income, especially for suburban commuters. Second, higher diesel and shipping costs can raise the price of building materials and maintenance. Third, renewed inflation pressure can keep mortgage rates higher for longer because lenders and bond investors demand compensation for inflation risk.
That is why the consumer experience feels worse than the headline housing data suggests. Food at home rose 2.9% over the year, shelter rose 3.3%, gasoline rose 28.4%, and household furnishings and operations rose 3.9% over the year ending April 2026 (U.S. Bureau of Labor Statistics). A buyer does not live inside a median price chart. A buyer lives inside a monthly budget. ** Affordability Is the Center of the Story**
Affordability is the biggest issue in the housing market. Not prices alone. Not rates alone. Affordability is the combination of price, rate, income, insurance, taxes, and other required costs.
ATTOM’s Q1 2026 affordability report found that homes were less affordable than historical averages in 97% of the 580 counties it analyzed (ATTOM). In 69.1% of those counties, major monthly homeownership expenses exceeded 28% of typical local wages, which is the traditional affordability benchmark used in the report (ATTOM). Nationally, the typical worker would need to spend 30.3% of wages on major expenses for a median-priced home, and a buyer needed $84,230 in annual income to keep those costs below the 28% threshold (ATTOM).
The National Association of Realtors shows a slightly more positive trend, but it still points to a strained market. NAR’s Housing Affordability Index registered 110.6 in April 2026, up from 101.4 one year earlier, meaning affordability improved because mortgage rates were lower and income growth outpaced home price growth (National Association of Realtors). But “improved” does not mean “easy.” It means the market is less painful than it was at the worst moments of the recent cycle.
Insurance is now a major affordability factor. The Zebra estimated the average annual homeowners insurance cost at $2,966 nationally in 2026, but Florida’s average was $9,449, the highest in the country (The Zebra). The Zebra also reported that 47% of homeowners said they would struggle to afford their mortgage if insurance premiums rose in the next year, and 74% of new buyers said homeowners insurance played a large part in their overall housing budget (The Zebra).
Insurance pressure is not only a Florida issue. The Federal Reserve Bank of Dallas reported that the median Texas homeowner paid 60% more for home insurance in 2024 than in 2019, compared with a 30% national increase over the same period (Federal Reserve Bank of Dallas). The Dallas Fed tied Texas premium growth to rising construction costs, climate risk, severe weather, reinsurance costs, labor shortages, and replacement-cost inflation (Federal Reserve Bank of Dallas).
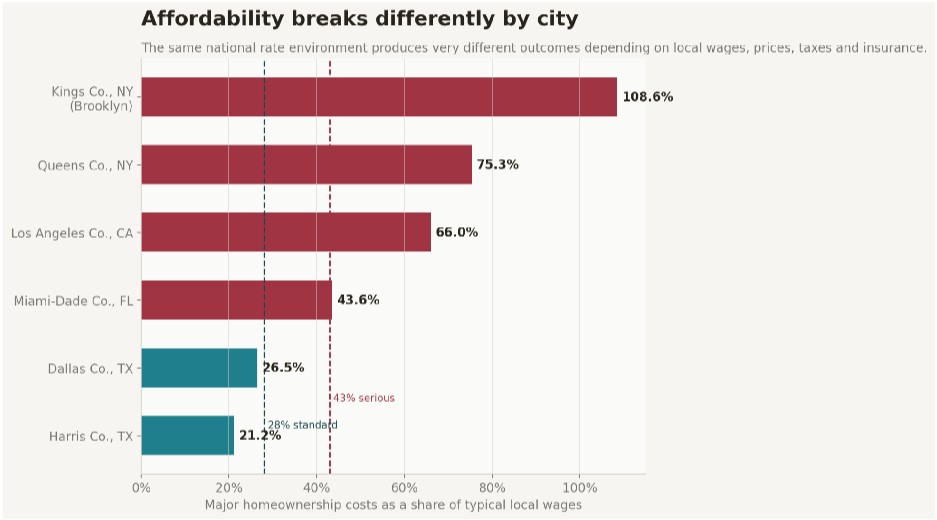
Chart note: Affordability is local. ATTOM’s Q1 2026 data shows that typical homeownership costs consumed 108.6% of typical wages in Kings County, New York, 66.0% in Los Angeles County, 43.6% in Miami-Dade County, and much lower shares in major Texas counties (ATTOM).
** New York: High Rents, Low Mobility, and a Brutal Moving Penalty**
New York is not just expensive. It is structurally difficult to move within. That is one of the most important differences between New York and many other markets.
In Q1 2026, the median asking rent in New York City was $3,616, up 6.2% from a year earlier, while Manhattan’s median asking rent reached $4,878, up 8.3% year over year (Realtor.com NYC Rent Analysis). Brooklyn’s median asking rent was $3,985, Queens was $3,427, and the Bronx was $3,099 (Realtor.com NYC Rent Analysis).
The bigger story is the gap between what current tenants pay and what the open market now demands. Realtor.com estimated that the typical New York City renter pays $1,855 per month in 2026, which is $1,761 below the median asking rent for available units (Realtor.com NYC Rent Analysis). That gap means a typical renter would need roughly $70,440 in additional annual income to move within the city while staying under the 30% affordability threshold (Realtor.com NYC Rent Analysis).
New York’s ownership market is also severely stretched. ATTOM estimated that home expenses consumed 108.6% of typical wages in Kings County, 75.3% in Queens County, and 72.1% in Nassau County in Q1 2026 (ATTOM). The New York metro did show some listing relief, with Realtor.com reporting that active listings rose 6.2% year over year and new listings rose 11.4% in April 2026, while the median list price fell 2.1% to $772,929 (Realtor.com April 2026 Housing Report).
The practical takeaway is that New York has a mobility crisis. People may want to move for family, work, schools, or lifestyle, but moving often means accepting a huge rent reset or a massive ownership cost. That keeps people locked into homes and apartments that may no longer fit their lives.
Miami: Still Desirable, But the Monthly Math Has Changed
Miami remains one of the most desirable cities in the country, but desirability does not erase affordability pressure. The Miami story is no longer just “everyone wants to move here.” The new story is that buyers and renters are more sensitive to the total monthly cost.
In April 2026, Miami’s median list price was $625,000, down 3.8% year over year, while active listings fell 7.0% to 7,364 and new listings fell 9.9% (Realtor.com Miami Market Report). Homes took a median of 78 days to sell, far longer than the national median of 52 days, which gave buyers more negotiating power than they had during the hottest years of the market (Realtor.com Miami Market Report).
Miami’s rental market has also softened from the extreme pressure of the pandemic years. In the Miami-Fort Lauderdale-West Palm Beach metro, the median asking rent was $2,236 in January 2026, down 3.7% year over year, and Realtor.com described the metro as renter-friendly for a second consecutive year (Realtor.com Miami Rent Analysis). Renting remained the more affordable monthly option because home prices stayed high relative to rents (Realtor.com Miami Rent Analysis).
The issue in Miami is not simply the purchase price. Insurance, taxes, HOA fees, condo assessments, and maintenance have become part of the affordability conversation. Florida’s average homeowners insurance cost was estimated at $9,449 per year in 2026, far above the national average of $2,966 (The Zebra). For a buyer already stretching to afford a Miami home, that insurance burden can be the difference between qualifying and not qualifying.
Miami is still not cheap, and it is not suddenly a buyer’s paradise. But the psychology has changed. Buyers are more patient, sellers have to price correctly, and the monthly cost of ownership now matters more than the headline asking price. ** Texas: More Inventory, More Price Cuts, and a Different Kind of Affordability Pressure**
Texas is one of the most important housing markets to watch because it shows what happens when supply improves. Unlike New York or San Francisco, Texas has had more new construction, more land, and more inventory growth. That gives buyers more leverage, but it does not eliminate affordability pressure.
The Texas Real Estate Research Center reported that statewide closed sales fell 2.2% year over year in February 2026, while the median home price fell 1.0% to $325,000 and active listings rose about 10% to roughly 134,400 (Texas Real Estate Research Center). Active inventory reached 4.8 months of supply, and the average days on market rose to 82 days, the first time February’s average exceeded 80 days since 2013 (Texas Real Estate Research Center).
The major Texas cities are not all behaving the same way. Austin recorded a 7.4% year-over-year sales increase, but prices remained among the weakest in the state, with persistent annual declines in the 2% to 3% range (Texas Real Estate Research Center). San Antonio had a 4.2% sales decline and a 7.6% year-to-date decline, while Houston’s annual price declines accelerated from 0.9% in January to 1.6% in February (Texas Real Estate Research Center). Dallas-Fort Worth showed continued price softening, with Fort Worth-Arlington showing signs of rising pricing pressure (Texas Real Estate Research Center).
Realtor.com’s April 2026 metro data shows the same theme. Austin’s median list price was $475,000, down 9.5% year over year, Dallas was flat at $430,000, Houston was down 2.7% to $359,897, and San Antonio was down 4.5% to $324,700 (Realtor.com April 2026 Housing Report). Price reductions were common in Texas metros, with 23.6% of Austin listings, 22.1% of Dallas listings, 18.2% of Houston listings, and 24.9% of San Antonio listings showing price cuts in April (Realtor.com April 2026 Housing Report).
Texas is more affordable than coastal California or New York by purchase price, but insurance and property taxes are changing the equation. The Dallas Fed reported that Texas homeowners with mortgages spent 7.9% of total household costs on insurance in 2024, while owners without mortgages spent 14.9% (Federal Reserve Bank of Dallas). ATTOM still found Harris County, Dallas County, and Bexar County among the more affordable large counties by wage burden, but the rising cost of ownership means Texas affordability is not as simple as the listing price suggests (ATTOM).
The Texas market is what normalization looks like. Sellers must compete. Buyers have more choice. Prices can soften. But the total cost of owning remains under pressure because insurance, taxes, and financing costs are still high.
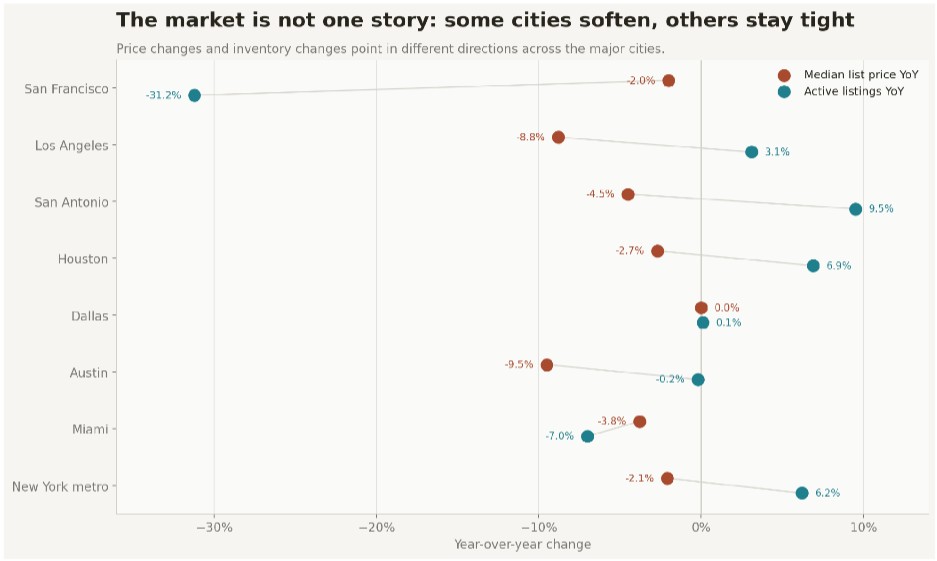 *
Chart note: The market is splitting by city. Austin and Los Angeles show sharper price softening, Texasmetros show more inventory relief, Miami has slower movement despite fewer listings, and San
Francisco remains tight because active listings fell sharply year over year (Realtor.com April 2026 Housing Report, Realtor.com Miami Market Report, Realtor.com Los Angeles Market Report,
Realtor.com San Francisco Market Report).*
*
Chart note: The market is splitting by city. Austin and Los Angeles show sharper price softening, Texasmetros show more inventory relief, Miami has slower movement despite fewer listings, and San
Francisco remains tight because active listings fell sharply year over year (Realtor.com April 2026 Housing Report, Realtor.com Miami Market Report, Realtor.com Los Angeles Market Report,
Realtor.com San Francisco Market Report).*
Los Angeles: Prices Are Softening, But the Market Is Still Out of Reach
Los Angeles is one of the clearest examples of the difference between a price correction and affordability. Prices can fall, but if the starting point is extremely high, the market can still be unaffordable.
In April 2026, the median list price in Los Angeles was $1,185,226, down 8.8% year over year, while active listings rose 3.1% to 3,190 and new listings fell 7.8% (Realtor.com Los Angeles Market Report). The median days on market reached 52 days, up 13% year over year, which means homes were sitting longer even though new supply was not flooding the market (Realtor.com Los Angeles Market Report).
The affordability numbers are harsh. The California Association of Realtors reported that only 18% of households in Los Angeles County could afford a median-priced single-family home in Q1 2026, with a median price of $858,510, a monthly payment of $5,210, and a minimum qualifying income of $208,400 (California Association of Realtors). The broader Los Angeles metro had the same 18% affordability share, with a $825,000 median price, $5,010 monthly payment, and $200,400 required income (California Association of Realtors).
ATTOM’s data reinforces the point. Los Angeles County home expenses consumed 66.0% of typical wages in Q1 2026, far above standard affordability thresholds (ATTOM). That means even with price reductions, Los Angeles remains inaccessible to many local wage earners.
The Los Angeles market is not collapsing. It is repricing. Sellers who price aggressively from the start are better positioned, while overpriced listings sit longer. Buyers have a little more room to negotiate, but they still need very high income, strong credit, and a large down payment to compete.
San Francisco: Tight Supply, Tech Wealth, and No Room for Hesitation
San Francisco is moving differently from many other large markets. While Los Angeles and parts of Texas show softer conditions, San Francisco remains highly constrained by supply and supported by wealth from the technology economy.
In April 2026, San Francisco had only 747 active listings, down 31.2% from a year earlier, while new listings were relatively stable at 672 homes (Realtor.com San Francisco Market Report). The median listing price was $1,172,000, down roughly 2% year over year, but only 7% of listings had price reductions, compared with 16.7% nationally (Realtor.com San Francisco Market Report). Homes spent a median of 48 days on the market, down from 53 days a year earlier and faster than the national median of 52 days (Realtor.com San Francisco Market Report).
The California Association of Realtors reported that only 20% of San Francisco County households could afford a median-priced single-family home in Q1 2026, with a median price of $1,975,500, a monthly payment of $11,990, and a required annual income of $479,600 (California Association of Realtors). For the broader San Francisco Bay Area, affordability was 24%, with a $1.3 million median price, $7,890 monthly payment, and $315,600 required income (California Association of Realtors). This is a market where affordability is terrible, but supply is so tight that prices do not need to fall much. Buyers are not winning because the market is cheap. Sellers are still supported because there are not enough good homes for sale, and the local economy continues to generate high-income buyers.
Why the Market Feels So Uneven
The real estate market is no longer one national story. It is a collection of local stories shaped by supply, income, migration, insurance, taxes, job growth, and construction.
New York is a rent-and-mobility crisis. Miami is a lifestyle-demand market facing insurance, HOA, and ownership-cost pressure. Texas is a supply-normalization market where prices are softening because buyers have more choices. Los Angeles is an affordability crisis with modest price relief but still severe income barriers. San Francisco is a constrained-supply market where even small price declines do not change the fact that the required income is enormous.
This unevenness explains why one person says the market is crashing while another says homes are still selling fast. Both can be right, depending on the city, price point, and property type. A condo in an insurance-heavy coastal Florida building is not the same market as a single-family home in a tight San Francisco neighborhood. A new-build suburb outside Austin is not the same market as a rent- stabilized apartment in Manhattan.
What Buyers Should Understand Right Now
Buyers should stop asking only, “Is the price coming down?” The better question is, “What is the full monthly cost, and how stable is that cost over time?”
That means buyers need to examine the mortgage payment, insurance premium, property taxes, HOA fees, utility costs, commute costs, maintenance reserves, and future assessment risk. In high-insurance states like Florida and Texas, a buyer should treat insurance as a core affordability variable, not a closing detail. In high-cost cities like New York, Los Angeles, and San Francisco, buyers should run conservative numbers because even small rate changes can materially affect the payment.
Buyers also need to know which markets offer leverage. In Texas and parts of Los Angeles or Miami, longer days on market and higher price-cut activity may create room to negotiate. In San Francisco and tight New York submarkets, hesitation can still cost a buyer the right property.
What Sellers Should Understand Right Now
Sellers are no longer in the easy-money market of 2021. Buyers have more information, higher monthly costs, and less tolerance for overpricing. The listing price must make sense on day one.
Nationally, the share of active listings with price reductions was 16.7% in April 2026, while the median list price fell 1.4% year over year for the sixth consecutive month of annual decline (Realtor.com April 2026 Housing Report). That does not mean sellers are losing everywhere. It means buyers are punishing unrealistic pricing, especially when rates, insurance, and living costs already stretch the budget.
In markets like Miami and Los Angeles, presentation, pricing, and patience matter more than hype. In Texas, sellers may need to compete directly with other listings and new construction. In San Francisco, sellers may still have leverage, but even there, accurate pricing is what separates strong outcomes from stale listings.
The Bottom Line
The current real estate market is not defined by a single headline. It is defined by a collision of forces: mortgage rates that are lower but still high, prices that are softening but not cheap, inventory that is improving but still uneven, and inflation pressure from energy and daily living costs that keeps households under stress.
Affordability is the main issue. Not because people stopped wanting homes, but because the cost of owning one now competes with every other part of life. Oil prices feed into gas, diesel, shipping, utilities, construction, and inflation expectations. Insurance costs are changing the math in Florida, Texas, California, and other risk-exposed markets. Property taxes, HOA fees, and repairs make the monthly payment bigger than the mortgage alone.
Affordability is the main issue. Not because people stopped wanting homes, but because the cost of owning one now competes with every other part of life. Oil prices feed into gas, diesel, shipping, utilities, construction, and inflation expectations. Insurance costs are changing the math in Florida, Texas, California, and other risk-exposed markets. Property taxes, HOA fees, and repairs make the monthly payment bigger than the mortgage alone.
The market is not frozen forever. If rates move lower, inventory keeps improving, and wage growth continues, more buyers can return. But until affordability improves in a meaningful way, the real estate market will remain divided: active at the right price, slow at the wrong price, and brutally expensive in the cities where demand still overwhelms supply.
Key Takeaway
The next phase of real estate will not be won by people who only watch home prices. It will be won by people who understand the full cost of living, the cost of capital, and the local supply story behind every market.